| front |1 |2 |3 |4 |5 |6 |7 |8 |9 |10 |11 |12 |13 |14 |15 |16 |17 |18 |19 |20 |21 |22 |23 |24 |25 |26 |27 |28 |29 |30 |31 |32 |33 |34 |35 |36 |37 |38 |39 |40 |41 |42 |43 |44 |45 |46 |47 |48 |49 |50 |51 |52 |53 |54 |55 |56 |57 |58 |59 |60 |61 |62 |63 |64 |65 |66 |review |
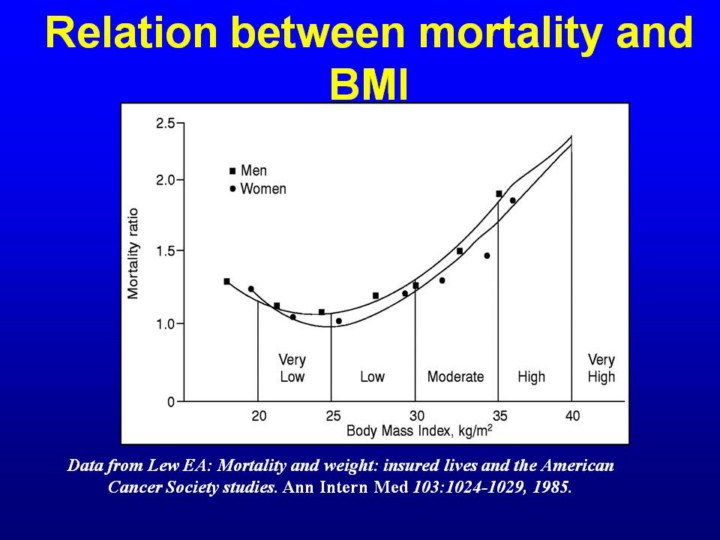 |
Figure 1. Relation between mortality and BMI. At a BMI below 20 kg/m2 and above 25 kg/m2, there is an increase in relative mortality for men and women. Data from Lew EA: Mortality and weight: insured lives and the American Cancer Society studies. Ann Intern Med 103:1024-1029, 1985. Reprinted with permission from the author of Ref. 46. |