| front |1 |2 |3 |4 |5 |6 |7 |8 |9 |10 |11 |12 |13 |14 |15 |16 |17 |18 |19 |20 |21 |22 |23 |24 |25 |26 |27 |28 |29 |30 |31 |32 |33 |34 |35 |36 |37 |38 |39 |40 |41 |42 |43 |44 |45 |46 |47 |48 |49 |50 |51 |52 |53 |54 |55 |56 |57 |58 |review |
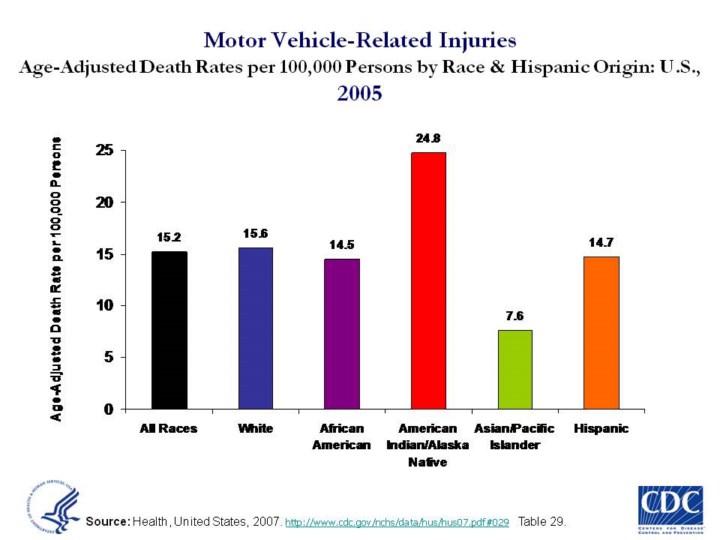 |
Updated
6/2/08 by SB. Motor vehicle crashes and pedestrian-related injury were the leading causes of unintentional injury-related death among American Indians/Alaska Natives (AI/AN) adults 20 years and older in 2003. Adult motor vehicle-related death rates for AI/ANs were almost twice that of whites and blacks. (16)
Compared to their female counterparts, AI/AN males ages 20 years and older are twice as likely to die from a motor vehicle crash (crude rates: males: 48.7 per 100,000; females: 22.1 per 100,000) (17). Among Native Americans 19 years and younger, motor vehicle crashes were the leading cause of injury-related death, followed by suicide, homicide, drowning, and fires. (16)
Adult pedestrian crude death rates (ages 20+, age-adjusted) for AI/ANs (6.7 per 100,000) were more than three times that of non-Hispanic whites (2.1 per 100,000) and almost twice that of blacks (3.6 per 100,000). (17)
Slide source (9) |