| front |1 |2 |3 |4 |5 |6 |7 |8 |9 |10 |11 |12 |13 |14 |15 |16 |17 |18 |19 |20 |21 |22 |23 |24 |25 |26 |27 |28 |29 |30 |31 |32 |33 |34 |review |
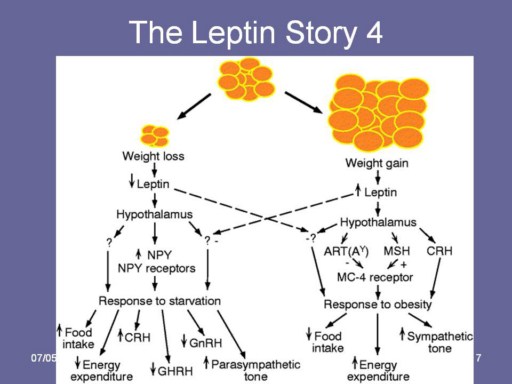 |
A complex. diagram indicating the complex and interactive response –endocrine and nervous to Leptin levels
This is demonstrated by the Response to 1.Starvation Increased appetite, diminished energy expenditure and an increase in parasympathetic tone
2.Obesity Reduced appetite, increased energy expenditure and increased sympathetic tone |