 |
This is
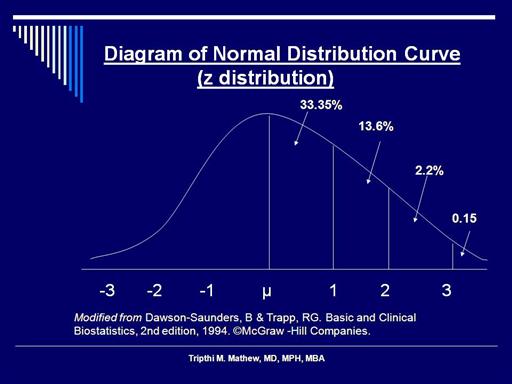
the diagram of a normal distribution curve or z distribution. Note the bell
shape of the curve and that its ends/tail don’t touch the horizontal axis
below. As I mentioned earlier, the area under the curve equals 1 or 100%.
Therefore, each half of the distribution from the center (that is from the
mean is equal to 50%. Thus, the area from/above the mean up to 1 standard
deviation is equal to 33.35%, area above +1 standard deviation is equal to
13.6%, the area above +2 standard deviation is equal to 2.2% and area above
+3 standard deviations is equal to 0.1%. Since the other half is a mirror
image, the percentage/proportion of area above -1 standard deviation is the
same as the area above + 1 standard deviation i.e. it is 33.35%. And -2
standard deviation=+2 standard deviation and so forth….
|