| front |1 |2 |3 |4 |5 |6 |7 |8 |9 |10 |11 |12 |13 |14 |15 |16 |17 |18 |19 |20 |21 |22 |23 |24 |25 |26 |review |
 |
http://www.census.gov/popest/national/asrh/files/NC-EST2007-ALLDATA-R-File24.csv
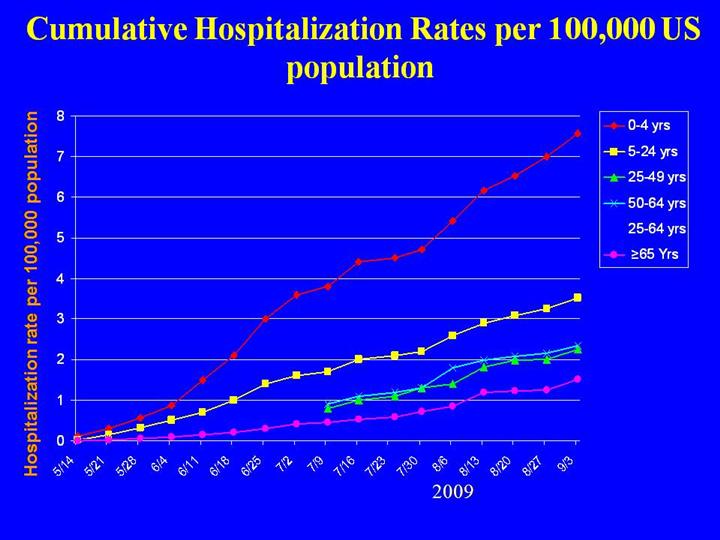
-Slide just as an FYI for a quick view of how the hospitalization rates have increased in the different age groups -All states did not have cases and thus hospitalizations since May -The age group 25-64 was changed to two age groups 25-49 and 50-64 after July 2, 2009 -Data is cumulative -Denominator numbers (just to have them here too in case) total US is 304,059,724, 0-4 is 21,005,852, 5-24 is 82,693,215, 25-64 is 161,490,941, 25-49 is 106,718,371, 50-64 is 55,675,687, and > 65 is 38,869,716
|