| front |1 |2 |3 |4 |5 |6 |7 |8 |9 |10 |11 |12 |13 |14 |15 |16 |17 |18 |19 |20 |21 |review |
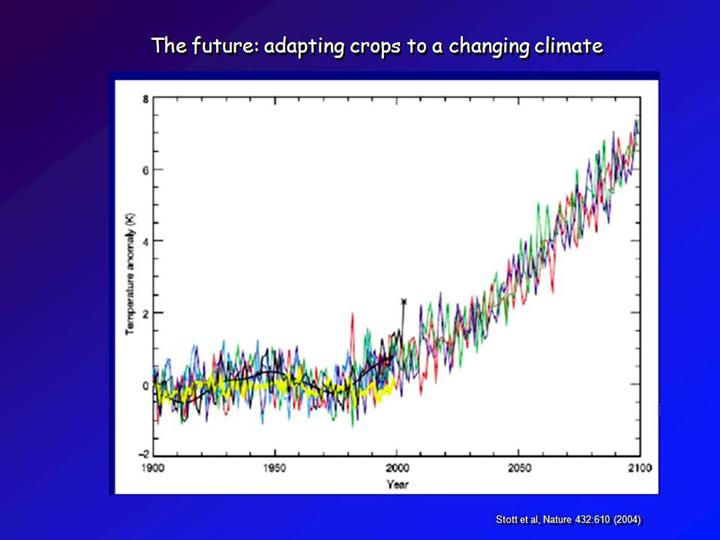 |
Here’s what this means for changing global temperatures, shown with respect to the average temperature in 1900. Black lines are observed temperatures, smoothed and unsmoothed. Red, blue and green lines are Hadley Centre simulations with natural and anthropogenic forcing. Yellow is natural only. The asterisk is the 2003 European heat wave of 2003. No matter what projections you use, no matter how rapidly we bring our greenhouse gas emissions under control, such summers will become more frequent in the coming decades and will be the typical summer in just a few decades. But our major crops were sculpted by people over tens of thousands of years in this moderate temperature range.
|