| front |1 |2 |3 |4 |5 |6 |7 |8 |9 |10 |11 |12 |13 |14 |15 |16 |17 |18 |19 |20 |21 |22 |23 |24 |25 |26 |27 |28 |review |
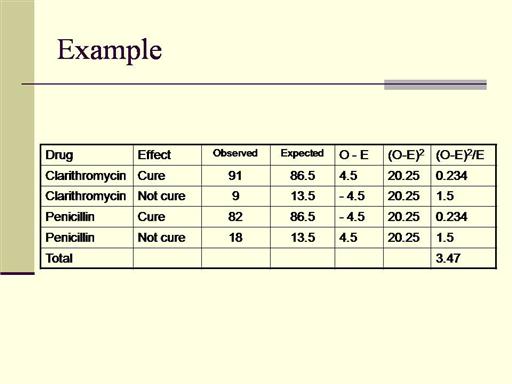 |
X2=3.47 . How many degree of freedom correspond to this table? Degree freedom= (number of columns –1) x (number of rows – 1) =1. IN a 2 x 2 table the degree of freedom, always will be 1. The result is referrered to the X2 distribution tables and 1 degree of freedom, p-value is 0.1<3.47>0.05. Do you accept or reject the null hypothesis? The result is limítrofe. We need the confidence intervals to determine if reject or accept the null hypothesis. |