| front |1 |2 |3 |4 |5 |6 |7 |8 |9 |10 |11 |12 |13 |14 |15 |16 |17 |18 |19 |20 |21 |22 |23 |24 |25 |26 |review |
 |
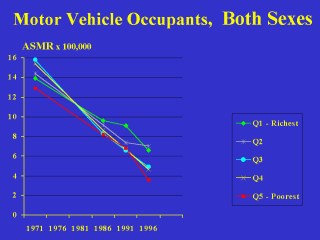
For motor
vehicle occupants of both sexes, the gradient was inverted, with the lowest rates in the
poorest quintiles, and higher rates in richer quintiles. This may be due in part to differential exposure to risk (fewer vehicle-miles travelled by residents of poorer quintiles). |