| front |1 |2 |3 |4 |5 |6 |7 |8 |9 |10 |11 |12 |13 |14 |15 |16 |17 |18 |19 |20 |21 |22 |23 |24 |review |
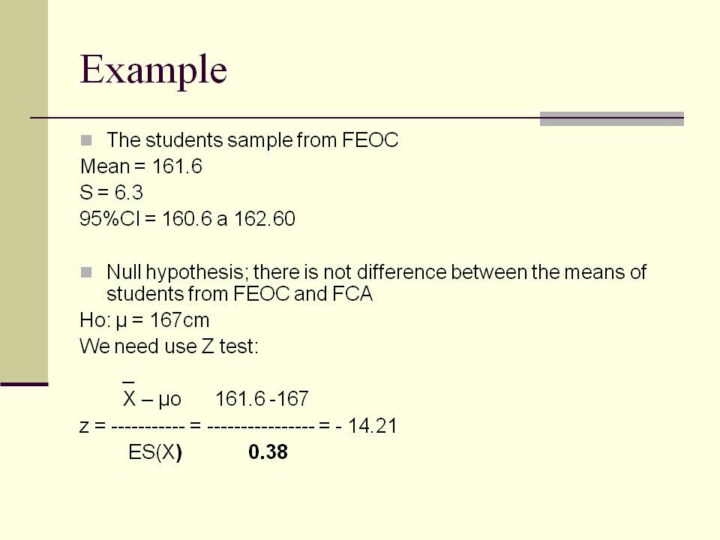 |
Confidence interval does not include the mean of students from FCA (167 cm), this is evidence against the null hypothesis. Remembered how interpret us the standardized Normal values, these say us how many standard errors the means is from the μo, if the null hypothesis is true. We can use the two tails tables from standard Normal distribution to find the p value for Z = -14.21, it is <0.0001 (or 0.1%). P value say us the probability to observe a difference equal or more extreme that it was find, if the null hypothesis is true. Then, the probability of the sample mean is 5.4 cm up or down of the hypothesis mean is less that 0.01%. Due to this, it is not probably to obtain a mean of 161.6 if the true mean in the population was 167 cm. We conclude that the mean of 161.6 is different that 167 cm.
|