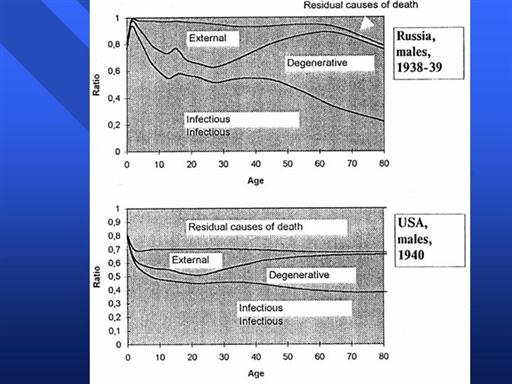
Figure 4.2 shows for each age group the proportion of mortality
due to four principal diagnostic
categories of causes of death: 1) infectious diseases (tuberculosis,
diarrheal diseases, all other food-born or air-born infections,
influenza, rheumatism, pneumonia and other acute respiratory diseases,
septicemia, inflammatory diseases, venereal diseases, etc.); 2)
degenerative diseases (cardiovascular diseases, cancers, chronic
respiratory, digestive, geneto-urinary, nervous diseases); 3) external
causes (accidents and violence); and 4) other and unspecified causes.
The top figure presents information for Russian males in 1938-1939 while
the lower panel presents the same information for U.S. males in 1940.