| front |1 |2 |3 |4 |5 |6 |7 |8 |9 |10 |11 |12 |13 |14 |15 |16 |17 |18 |19 |20 |21 |22 |23 |24 |25 |26 |27 |28 |29 |30 |31 |32 |33 |34 |35 |36 |37 |38 |39 |40 |41 |42 |43 |44 |45 |46 |47 |48 |49 |50 |51 |52 |53 |54 |review |
 |
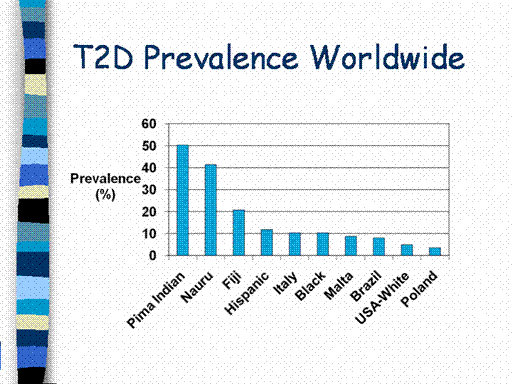
This figure
illustrates the geographic differences in the prevalence of T2D.
The highest prevalence rates are seen in the Pima Indians in the
South Western United States, the Nauru in Micronesia, and Fiji.
So, while T1D is rare in American Indians, T2D is quite common.
T2D is also known to be more predominant in Hispanic and African
American populations than Caucasian populations.
Worldwide, prevalence rates are similar for men and women,
although they are slightly higher in men less than age 30 years and in
women older than age 65 years.
In 2000, the
overall prevalence of T2D was estimated to be 2.8%, but projections for
2030 have almost doubled (4.4%).
This corresponds to a worldwide increase from 171 million persons with
diabetes in 2000 to 366 million persons in 2030.
|