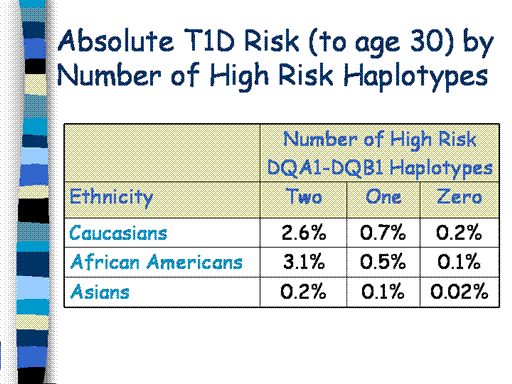
This table
illustrates the absolute risk (or actual likelihood) of developing T1D
depending on the number of high risk haplotypes an individual carries.
For example, Caucasians and African Americans with two high risk
haplotypes have about a 3% chance of developing the disease before age
30 years, depending on the population.
The risk for Asians with two high risk haplotype is much lower
(less than 1 %). Therefore, even
if a person carries high risk haplotypes, their chances of developing
T1D are quite low irrespective of their ethnicity.
