| front |1 |2 |3 |4 |5 |6 |7 |8 |9 |10 |11 |12 |13 |14 |15 |16 |17 |18 |19 |20 |21 |22 |23 |24 |25 |26 |27 |28 |29 |30 |31 |32 |33 |34 |35 |36 |37 |38 |39 |40 |41 |42 |43 |44 |45 |46 |47 |48 |49 |50 |51| 52 |53 | 54 |review |
 |
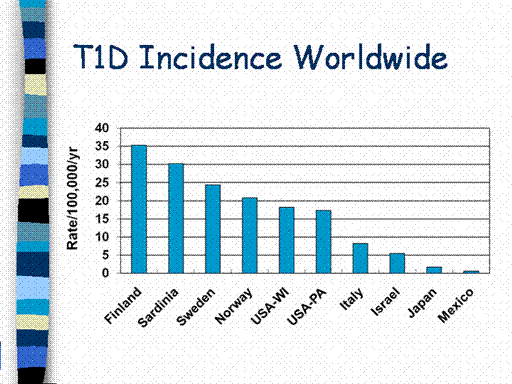
This figure
characterizes the dramatic geographic differences in T1D incidence.
Countries with the highest incidence include Finland, Sardinia, and
the Scandinavian countries. Those
with lowest are found in Asia. In
addition, Native-Americans and some populations in Latin America have an
extremely low incidence of the disease. The dramatic difference in T1D
incidence worldwide are likely related to variations in the prevalence of
the genetic and environmental risk factors for the disease.
|