| front |1 |2 |3 |4 |5 |6 |7 |8 |9 |10 |11 |12 |13 |14 |15 |16 |17 |18 |19 |20 |21 |22 |23 |24 |25 |26 |27 |28 |29 |30 |31 |32 |33 |34 |35 |36 |37 |38 |39 |40 |41 |42 |43 |44 |45 |46 |47 |48 |49 |review |
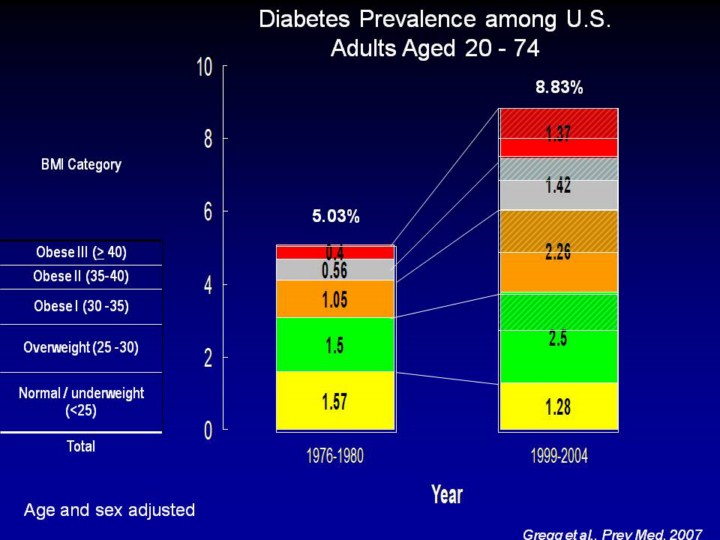 |
In 1976-1980 the prevalence was 5.03%. In 1999-2004, the prevalence is 8.8. In 1988-1994 it was roughly half way in between or 7.02%, but I am not showing that on this slide.
Now, when we partition the prevalent diabetes cases in to their respective BMI categories, we see that of the 5 cases, there were about 1.6 cases who were lean, 1.5 …….etc.
When we do the same in 1999-2004, we see that there was a slight decline in the % who werein the normal/underwight group, an increase of 1 prevalent case per 100 populatoin who was diabetic and overweiht, an increase of 1.2 who were obese.
What we are doing in this analysis is simply taking the excess cases from each group, and examining the BMI contribution of those groups.
|