| front |1 |2 |3 |4 |5 |6 |7 |8 |9 |10 |11 |12 |13 |14 |15 |16 |17 |18 |19 |20 |review |
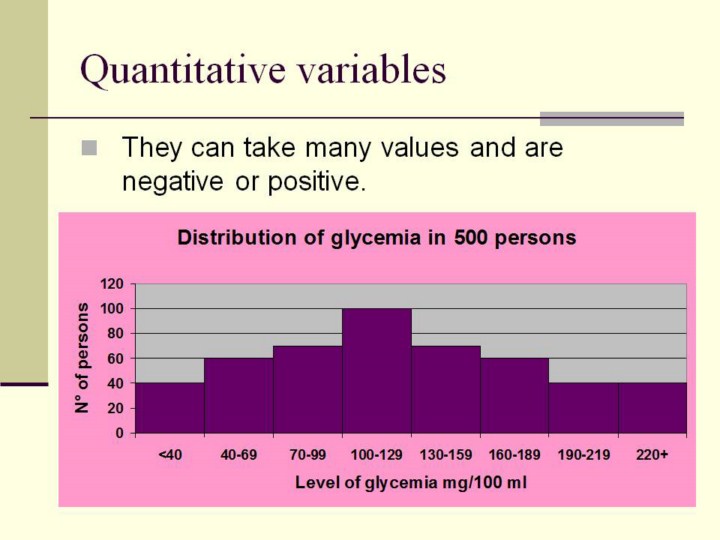 |
These are the results of glucose in blood in 500 persons in Celaya, Gto. The high of bar show the number of persons with glycemia levels in the interval in the X axis. If we add the high of all bars, we shall obtain a total sample size. |