| front |1 |2 |3 |4 |5 |6 |7 |8 |9 |10 |11 |12 |13 |14 |15 |16 |17 |18 |19 |20 |21 |review |
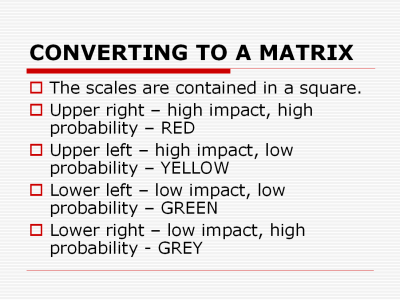 |
Values for probability and impact are plotted
on a square using the scales. Upper right (color coded red) – impact above 5, probability above 0.5. Upper left (color coded yellow) – impact above 5, probability below 0.5. Lower left (color coded green) – impact below 5, probability below 0.5. Lower right (color coded grey) – impact below 5, probability above 0.5. Fink recognizes the GREY area as a special problem. These events happen, and happen relatively frequently, but lack major impact. This does not mean that they should be ignored, because their cumulative effects may be significant. For example, in the United States a major disaster that kills 1000 or more people is rare, and attracts significant attention and concern. However, approximately 40,000 individuals die in highway accidents a year, attracting little attention. |