| front |1 |2 |3 |4 |5 |6 |7 |8 |9 |10 |11 |12 |13 |14 |15 |16 |17 |18 |19 |20 |21 |22 |23 |24 |review |
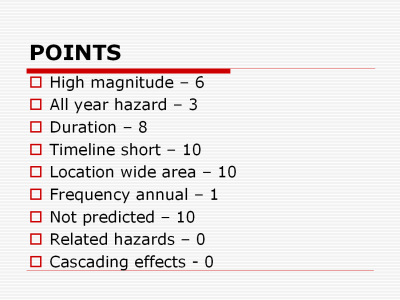 |
Using the same scenario, we could apply a range of numeric scores to each
factor based on
available data and our perception of the importance of
each factor (included in the decision instructions for the scale we
use). In this case, the Lamar
tornado receives a score of 48:
All year hazard (1 point per
month) – 3 points for the
April-June season.
Duration (1 point first day, 1
point first week, 1 point per month) – 8 points for the impact day
and week plus 6 months to rebuild. Timeline short (10
points for 1 hour or less of warning, 5 points for 1 day or less, 3
points for seasonal, 1 point for others) – 5 minutes or less of warning
for 10 points. Location wide area (community wide 10 points, or 1 point
for each 0.10 of the community that could be impacted) – 10 points for
possible community wide impact. Frequency annual (1 point for each .01
on a 100 year probability) – 1 point for an event that could happen once
every 100 years. Not predicted (10 points for no prediction, 5 points
for generalized watch, 3 points for specific warning within 24-48 hours,
1 point for other prediction) – 10 points for no specific predictions
available.
Related hazards (5 points for each
unique related hazard) – 0 points.
Cascading effects (5 points for
each unique cascading hazard) – 0 points.
|