| front |1 |2 |3 |4 |5 |6 |7 |8 |9 |10 |11 |12 |13 |14 |15 |16 |17 |18 |19 |20 |21 |22 |23 |24 |25 |review |
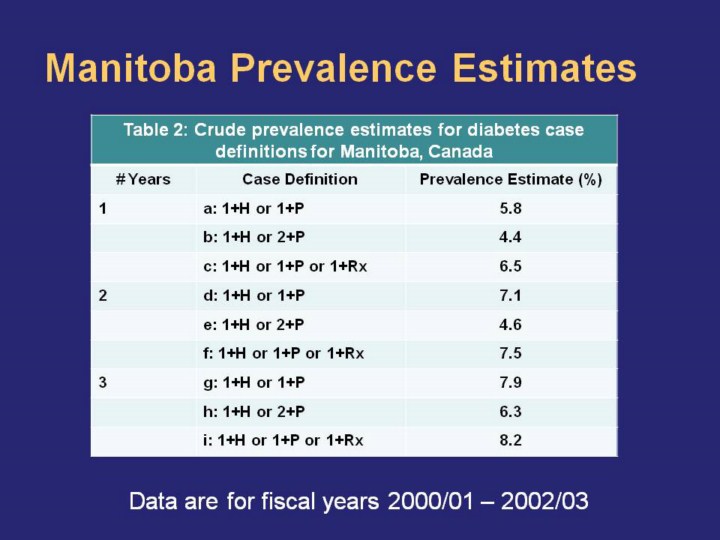 |
Nine case definitions will be discussed. Please refer to the MCHP report for the full list of case definitions investigated.
Note: H = hospital; P = physician, Rx = prescription drug; One-year case definitions are for fiscal year 2002/03, two-year case definitions are for fiscal years 2001/02 – 2002/03, and three-year case definitions are for fiscal years 2000/01 – 2002/03
Crude prevalence for these case definitions ranged from 4.4%-8.2%. For a given set of case definitions, increasing the number of years of data used resulted in an increase in prevalence estimates. For example, estimated crude prevalence using case definition a (1+H or 1+P, 1 year of data) was 5.8%; this increased to 7.1% when 2 years of data were used (case definition d).
Fewer cases are being captured when a more stringent case definition is used. For example, changing the case definition so that the number of physician visits resulting in a diabetes diagnosis increases from one to two results in a decrease in prevalence estimates. This is illustrated through the comparison of case definitions a and b; here prevalence decreases from 5.8% to 4.4%.
Alternatively, expanding the case definition to include another source of data (here prescription usage) increases the estimated prevalence. This is illustrated, for example, by comparing case definitions a and b to case definition c. Including the prescription usage data increases estimated prevalence to 6.5%. |