| front |1 |2 |3 |4 |5 |6 |7 |8 |9 |10 |11 |12 |13 |14 |15 |16 |17 |18 |19 |20 |21 |22 |23 |24 |25 |26 |27 |28 |29 |30 |31 |32 |33 |34 |35 |36 |37 |38 |39 |40 |review |
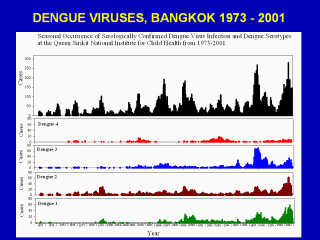 |
Distribution of confirmed hospitalized DHF cases at 2 month intervals from 1973 through 2001. There has been general upward trend with larger outbreaks at occuring at 2 – 5 year intervals. Peak hospitalization rates occur during the rainy season month of July – August. Colored graphs show isolations of different dengue viruses demonstrating off-set outbreaks of DENV 3 and 4 compared with DENV 1 – 2. |