Click for larger image |
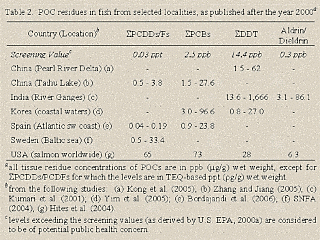
Table 2 here lists
the residue levels of POCs from sample studies reported since the year 2000.
All of these study results tend to be alarming, especially those in India
where the DDT levels appear to be extremely high. Their mean levels exceed
even Australia’s (legal) standard of 1.0 ppm (see
Table 1C in Part I). In fact,
recently a rather extensive collaboration study (Hites et al., 2004) was
conducted showing that for many of the POCs considered in this lecture, the
residue levels monitored in farmed salmon purchased or imported from
worldwide greatly exceeded U.S. EPA’s screening values. Note that the
residue data shown in Table 2 here are limited to what have been gathered
thus far. It does not necessarily reflect what is truly happening or could
happen. |
