| front |1 |2 |3 |4 |5 |6 |7 |8 |9 |10 |11 |12 |13 |14 |15 |16 |17 |18 |19 |20 |21 |22 |23 |24 |25 |26 |27 |28 |29 |30 |31 |32 |33 |34 |35 |36 |37 |38 |39 |40 |41 |42 |43 |review |
 |
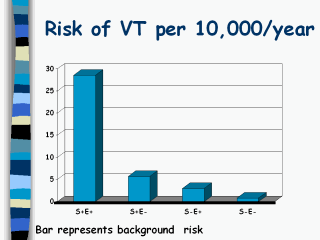
The data from the table in slide 26 are graphically represented above. The black bar shows the rate of VT among women who were in the S-E- group. The risk in the remaining groups that is above the black bar (or the baseline risk) reflects the attributable risks associated with the presence of the Factor V Leiden mutation and OCP use. These are illustrated on slide 28. |