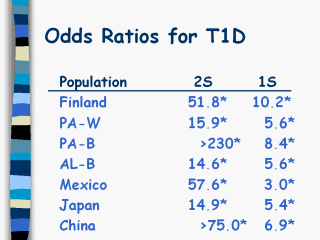
The method described on
slide 14 was used to determine the OR associated with 2S and 1S
haplotypes in the seven different populations listed above.
An “*” is used to represent statistical significance
(p<0.05). In each country,
there was a significant dose response – with a relative increasing
level of risk with increasing number of susceptibility haplotypes.
However, across countries – there was considerable variation
– particularly for the 2S groups.
This in part was due to small samples sizes.
For example, in our PA-black population, we found no control
with 2S haplotypes.
