 |
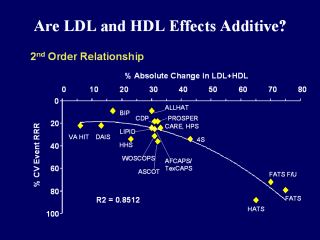
This graphs shows the second order relationship
of LDL+HDL and cardiovascular event risk reduction, using data from major
clinical trials of lipid-lowering therapy.
The percent change from baseline (or placebo) for LDL+HDL is added using
absolute values. This is plotted against the relative risk reduction in
composite endpoints from each of the trials. The trend line indicates that
these variables are highly correlated. In fact, it appears that the percent
absolute change in LDL+HDL during treatment in these clinical trials
accounts for 76% of the effect on cardiovascular event relative risk
reduction vs placebo in this crude analysis. |
