| front |1 |2 |3 |4 |5 |6 |7 |8 |9 |10 |11 |12 |13 |14 |15 |16 |17 |18 |19 |20 |21 |22 |23 |24 |25 |26 |27 |28 |29 |30 |31 |32 |33 |34 |35 |36 |37 |38 |39 |40 |41 |42 |43 |44 |45 |46 |47 |48 |49 |review |
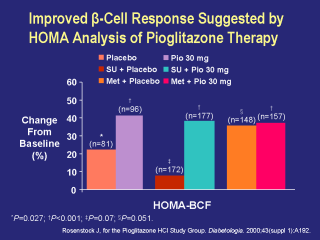 |
The above slide summarizes the calculated
percentage changes from baseline in beta-cell function at the conclusion of
three 16-week, double-blind studies, using homeostasis model assessment
(HOMA). The HOMA models followed standardized mathematical calculations designed to estimate beta-cell function and insulin resistance values. For an individual patient, a decrease in values for insulin resistance and an increase in values for beta-cell function indicate a positive effect on these parameters. HOMA BCF = 20 x fasting plasma insulin (µlU/mL) fasting plasma glucose (mmol/L) – 3.5 The pioglitazone 30 mg, the sulfonylurea + pioglitazone 30 mg, and the metformin + pioglitazone 30 mg treatment groups showed significant (P<0.001) improvements in beta-cell function, as calculated by HOMA-BCF, with changes of 41.4%, 38.0%, and 37.6%, respectively. Compared with baseline, the placebo, the sulfonylurea + placebo, and the metformin + placebo treatment groups also showed improvements in beta-cell function, with changes of 23.4% (P=0.027), 8.2% (P=0.07), and 36.8% (P=0.051), respectively. Rosenstock J, for the Pioglitazone HCl Study Group. Diabetologia. 2000;43(suppl 1):A192. Matthews DR, et al. Diabetologia. 1985;28:412-419. |