 |
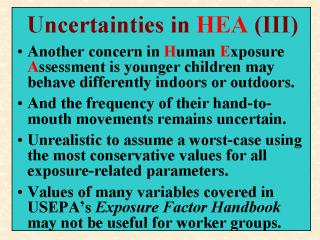
There also can
be uncertainties with the values used for soil ingestion, such as for children in
recreational areas where playground structures were treated with a wood preservative. Two-
or three-year-olds may or may not stay and play longer in the sandbox than those who are a
couple of years older. The hand-to-mouth movements of the younger children could also be
more frequent. Yet how well or how often their hands would be cleaned during playtime or
afterwards depends largely on how health conscious the children and their
guardians/parents are. It is unrealistic to assume the worst-case scenario using the
most conservative value for every parameter included in an exposure algorithm. This is one
main reason why probabilistic analysis should be used in place of point estimation (see,
e.g., Lecture 8; Dong and Ross, in press; Dong et
al., 1994a, 1994b; Paustenbach, 2001). On the other hand, to use a point value less
than the high-end, such as the mean or median, would require a substantial amount of
empirical data which is ever lacking. USEPA's Exposure Factors Handbook (1997)
provides the percentiles and other statistics of body weight (and of other factors) for
the general population by age and gender. Can these data be used to truly represent the
distribution of body weight for agricultural workers whose health status and physical
build could very well be different? If rough approximation is indeed all that takes, then
any effort to refine the data presented or discussed in the Exposure Factors Handbook
does not seem warranted. |
