| front |1 |2 |3 |4 |5 |6 |7 |8 |9 |10 |11 |12 |13 |14 |15 |16 |17 |18 |19 |20 |21 |22 |23 |24 |25 |26 |27 |28 |29 |30 |31 |32 |33 |34 |review |
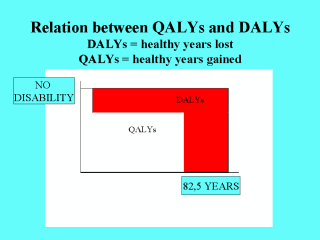 |
Scematic
illustration of the complementarity between QALYs and DALYs. QALYs are years of healthy
life lived - DALYs are years of healthy life lost. Whereas DALYs represent a loss and should be minimised, QALYs represent a gain and should be maximised. In the DALY approach, the years are disability weighted on a scale from zero, which indicates perfect health (no disability), to one, which indicates death. In the QALY approach, the scale goes the opposite way: A quality weighting (sometimes called "utility") of 1 indicates perfect health, whereas 0 indicates no quality of life, and is synonymous to death. ( Age weighting and discounting factors are not included in this illustration). |