| front |1 |2 |3 |4 |5 |6 |7 |8 |9 |10 |11 |12 |13 |14 |15 |16 |17 |18 |19 |20 |21 |22 |23 |review |
 |
The
two most basic ways to describe residents are by age and gender. Patterns of
illness and health service needs often vary according to these two
characteristics.
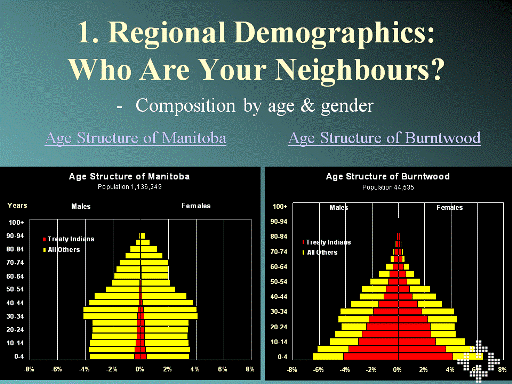
So, compared to other regions, how many people are likely to enter the door of the various types of health services? The “population pyramid” summarizes this information in one picture. E.G. In the pyramid above, the majority of the residents of the Burntwood RHA are younger (13% are 0 - 4 yrs old); 24% are females between ages 15 and 44. These percentages are similar to Manitoba overall, where 11% are between 0 and 4 yrs, and 22% are females between ages 15 and 44. However, in Manitoba, the distribution is less ‘triangular’, with the majority of residents between 30 and 39 years. Questions for Planners 1. How does the RHA’s population pyramid compare to the province? To other regions? 2. How will pyramid affect the types of service delivery? (Younger population may indicate younger families requiring prenatal care, maternity & pediatric services & immunization programs) 3. How many people could possibly require health services? |