 |
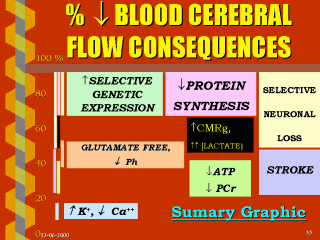
Graph summary where it's shown to the left axis in%,
Cerebral Sanguine Flow (CSF), while to the right side appear the consequences on
nervous tissue that will cause this decrease. For example, in an stroke area,
FSC of this area will be below 50%. Like one observes, these effects begin to
appear, when FSC diminishes below 90%. To values of the flow below 20% increases
K+ exit to extracellular space and decrease of Ca++ due to its massive entrance
into cells, with the consequent cellular death. (Modified of García-Salman D.)

|
Go to Comment Form
|
|