| front |1 |2 |3 |4 |5 |6 |7 |8 |9 |10 |11 |12 |13 |14 |15 |16 |17 |18 |19 |20 |21 |22 |23 |24 |25 |26 |27 |28 |29 |30 |31 |32 |33 |34 |35 |review |
 |
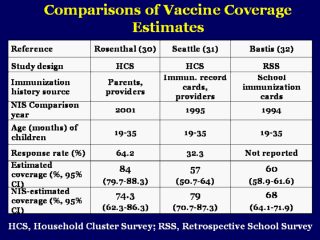
One way to assess the validity of NIS data is to compare results from the NIS to other surveys. This table compares coverage measured from household cluster surveys and retrospective school surveys to the NIS. Care should be taken in interpreting these data as the other surveys may also suffer from bias. Thus, we may be comparing two biased estimates of coverage. |