| front |1 |2 |3 |4 |5 |6 |7 |8 |9 |10 |11 |12 |13 |14 |15 |16 |17 |18 |19 |20 |21 |22 |23 |24 |25 |26 |27 |28 |29 |30 |31 |32 |33 |34 |35 |review |
 |
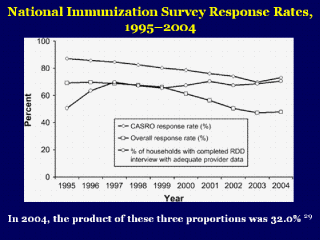
Other response rates that are useful for
comparisons of the NIS to other types of surveys are the CASRO response
rate, overall response rate and the proportion of households with completed
RDD interviews with adequate provider data. All of these response rates,
from 1995-2004, are shown in this figure. The product of these figures is
the composite response rate (32.0% in 2004). |