| front |1 |2 |3 |4 |5 |6 |7 |8 |9 |10 |11 |12 |13 |14 |15 |16 |17 |18 |19 |20 |21 |22 |23 |24 |25 |26 |27 |28 |29 |30 |31 |32 |33 |34 |35 |review |
 |
The greatest potential weakness of the NIS is
that it only captures data from a minority of eligible children.
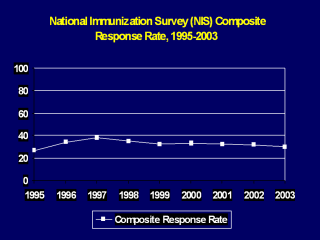
Non-participation occurs in the following situations: -The household has a telephone that is not reachable by the list-assisted survey (no phone, cell phone only, or broadband phone; 7.2% in 2002); -The household incorrectly reports that in the interview that a child 19-35 months does not live in the household (30.0% in 2002); -The parent does not complete the interview (9.3% in 2002) -Data are not returned form the provider in the Provider Record Check Survey (33.6% in 2002); and -Incomplete provider responses (15.3% in 2002). The proportion of eligible participants with complete immunization histories in the product of these five numbers: 92.8% X 70.0% X 90.7% X 66.4% X 84.7% = 33.1%. (27, 28, 29) The composite response rate of the NIS (how well the NIS sample represents the target population) has been steadily declining since 1997 (Figure). NIS attempts to statistically adjust for this non-response, but the effectiveness of these adjustments are uncertain as data are lost in each of five stages listed above. In particular, the adjustments for nonresponse rely on the assumption that the missing data are missing at random, i.e., sampled children for whom vaccination histories are obtained are similar to those for whom vaccination histories are not obtained by the NIS. This assumption has not been verified. |