 |
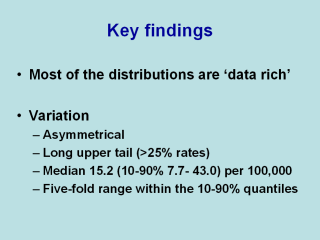
Our data suggest substantial variability, often
with over 25% of rates being in upper tail.
For persons in discrete core studies, 55 different studies provided 170
rates. The median value for rates was 15.2 per 100,000. The distribution was
positively skewed. Excluding the top and lower 10% of the distribution,
rates ranged from 7.7 to 43.0 per 100,000 (a five-fold difference). Because
schizophrenia has a relatively low level of prevalence, zero provides an
absolute 'floor' for the rate distribution. NB while the lower tails of the
distributions were usually data-sparse, many of the distributions had upper
tails that contained more than 25% of the rates. Several of the
distributions had marked positive skewness. Thus deviation is predominantly
for higher rather than lower estimates. |
