| front |1 |2 |3 |4 |5 |6 |7 |8 |9 |10 |11 |12 |13 |14 |15 |16 |17 |18 |19 |20 |21 |22 |23 |24 |review |
 |
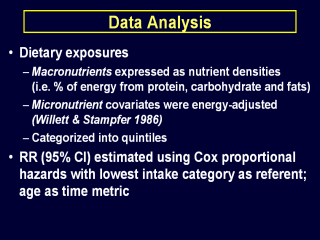
We expressed protein, carbohydrate and fats as
a percentage of total energy. Other nutrients treated as covariates were energy-adjusted using the regression method. All nutrients were categorized into quintiles of intake, and modeled categorically. Risk Ratios and 95% CI were estimated using Cox proportional hazards and modeled as a function of age with the lowest intake category as referent. |