| front |1 |2 |3 |4 |5 |6 |7 |8 |9 |10 |11 |12 |13 |14 |15 |16 |17 |18 |19 |20 |21 |22 |23 |24 |25 |26 |27 |28 |29 |30 |31 |32 |33 |34 |35 |36 |37 |38 |39 |40 |41 |42 |43 |44 |45 |46 |47 |review |
 |
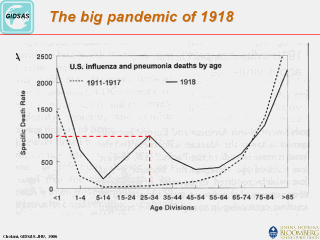
This graph demonstrated the age specific death
rate in the US due to influenza & pneumonia from 1911 to 1917 and compares
it to 1918. The age specific death rate is higher in all age divisions except in the 75+ age strata. The age specific death rate due to influenza and pneumonia was highest in the 25-34 year age strata. |