| front |1 |2 |3 |4 |5 |6 |7 |8 |9 |10 |11 |12 |13 |14 |15 |16 |17 |18 |19 |20 |21 |22 |23 |24 |25 |26 |27 |28 |29 |30 |31 |32 |33 |34 |35 |36 |37 |38 |review |
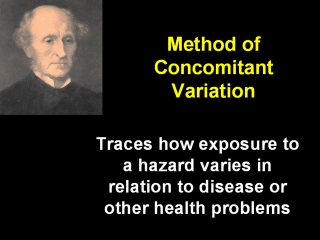 |
The prior graph
that showed correlational data on traffic fatality rates and
vehicles/population density illustrates the Method of Concomitant Variation.
The higher the rate of motor vehicles per 1,000 population, the higher the
traffic fatality rate per 1,000 vehicles. The Method of Concomitant
Variation is a quantitative approach to hypothesis formulation, in contrast
with the qualitative Methods of Agreement and Difference. |