| front |1 |2 |3 |4 |5 |6 |7 |8 |9 |10 |11 |12 |13 |14 |15 |16 |17 |18 |19 |20 |21 |22 |23 |24 |25 |26 |27 |28 |29 |30 |31 |32 |33 |34 |35 |36 |37 |38 |review |
 |
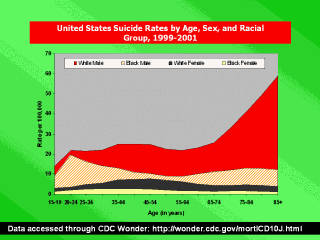
This graph shows
large differentials in annual average suicide rates by age, sex, and race.
As an aside, suicide is grossly undercounted, and variably so, thus very
different patterns might emerge if rates were corrected for relative
underenumeration. |