| front |1 |2 |3 |4 |5 |6 |7 |8 |9 |10 |11 |12 |13 |14 |15 |16 |17 |18 |19 |20 |21 |22 |23 |24 |25 |26 |27 |28 |29 |30 |31 |32 |33 |34 |35 |36 |37 |38 |review |
 |
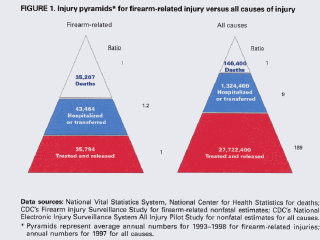
Taken from The
Injury Chartbook, published by the United States Department of Health
and Human Services in 1997, this injury example clearly demonstrates the
limitation of the iceberg mortality tip in reflecting the true dimensions of
a public health problem. A much more complete picture can emerge from adding
morbidity information. |