| front |1 |2 |3 |4 |5 |6 |7 |8 |9 |review |
 Age group Model
Intercept Median Median Country R2 Elderly US only
5255 -20.58 -
- .01 All ages US only 1110
-15.09 -
- .13
|
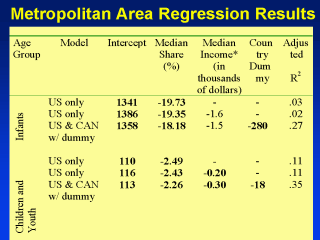
We then modeled the
metropolitan area data. The modeling proceeded incrementally within the different age
groups. First we looked at the U.S. states only with the median share of income as the
explanatory variable. Then we added median income. We then added in the 53 Canadian
metropolitan areas but when we did this we controlled, using a dummy variable, for the
longstanding mortality differences between the U.S. and Canada. The effect on income inequality on mortality is strongest for working age populations - a 1% increase in the share of household income to the poorer half of the income distribution is associated with a decline in the death rate of nearly 22 deaths per 100,000. |