| front |1 |2 |3 |4 |5 |6 |7 |8 |9 |10 |11 |12 |13 |14 |15 |16 |17 |18 |19 |20 |21 |22 |23 |24 |25 |review |
 |
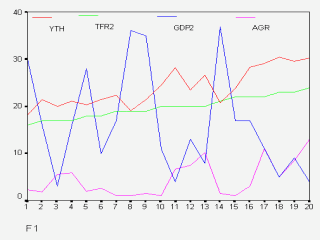
1/ Canada, 2/
Br Virgin Is, 3/ Cuba, 4/ Barbados, 5/ Aruba, 6/ Trinidad & Tabasco, 7/
Puerto Rico, 8/ Bermuda, 9/ Caymen Is, 10/ Netherland Antilles, 11/ Jamaica,
12/ Uruguay, 13/ Brazil, 14/ USA, 15/ US Virgin Is, 16/ Bahamas, 17/
Argentina, 18/ Venezuela, 19/ Costa Rica and 20/ Suriname.
The F1 and the F2 diagrams are ordered on TFR from 1/ Canada to 38/ Haiti. TFR = 10 TFR. GDP = GDP/1000. Whether nationals are rich or poor does not necessarily relate to wealth as GDP. However, higher TFR is harshly increasing the poverty of the large-family nations. |