| front |1 |2 |3 |4 |5 |6 |7 |8 |9 |10 |11 |12 |13 |14 |15 |16 |17 |18 |19 |20 |21 |22 |23 |24 |25 |26 |27 |28 |29 |30 |31 |32 |33 |34 |35 |36 |37 |38 |39 |40 |41 |42 |43 |44 |45 |review |
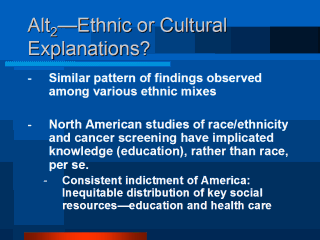 |
A very conservative comparison for example, found relatively poor white cancer patients from the 3-county metropolitan Detroit area to be as disadvantaged relative to similarly poor patients in greater metropolitan Toronto (multi-ethnic sample, race/ethnicity not coded in the Ontario Cancer Registry). |