| front |1 |2 |3 |4 |5 |6 |7 |8 |9 |10 |11 |12 |13 |14 |15 |16 |17 |18 |19 |20 |21 |22 |23 |24 |25 |26 |27 |28 |29 |30 |31 |32 |33 |34 |35 |review |
 |
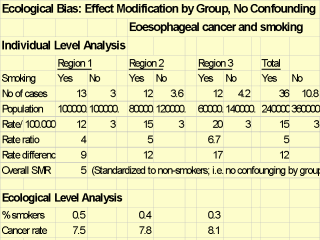
We have 3 areas, with varying rate ratios for smoking. After standardization, the SMR is 5 and this is equal to the crude rate ratio of 5 (in the Total column). Therefore, there is no confounding using the individual level data. The ecological regression analysis, using % smokers and the cancer rate, shows an inverse relationship (intercept of 9 and slope of -3), and this is due to the differences in rate differences between groups. |
Ecological regression rate = 9 - 3 * % In the absence of individual data above
Estimated ecological rate ratio = 0.67 (1 - 3/9)
From Greenland and Morgenstern, Int J Epidem 1989; 18: 269-74