 |
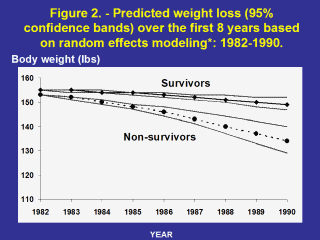
* Model adjusted
for age, sex, housing strata, and interaction of each with time. Figure 2
shows predicted weight loss (95% confidence bands) in survivors and
non-survivors over the first 8 years of follow-up based on a simple random
effects model of age, sex, housing, and the interaction of each of these
variables with follow-up time. In 1982, the number of Survivors and
Non-survivors was 905 and 1395, respectively; in 1988, it was 803 and 612,
respectively, in 1990, 782 and 351; and in 1994, 769 and 32, respectively.
The two different trajectories of weight loss between survivors and
non-survivors is striking, especially after 1985.
|
