 |
* p<0.001 based on
t-test for independent samples; # p<0.01 based on chi-square test.
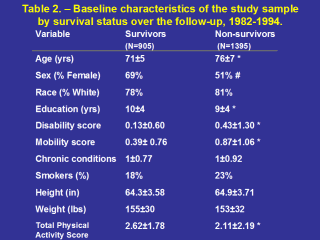
Table 2 shows subject characteristics by survival status.
Although height and weight were similar between those who did and did not
survive the 12 year follow-up period, there were statistical differences
between groups in several of the study variables – namely, age, sex,
disability and mobility scores, and total activity score. The average total
activity score was 2.62 among the survivors and 2.11 among the
non-survivors. For reference, obtaining a median score of 2 could be
accomplished by participating in a single activity, such as walking, "often
in the past month". This low frequency of reported activity is consistent
with other data for older populations.
|