| front |1 |2 |3 |4 |5 |6 |7 |8 |9 |10 |11 |12 |13 |14 |15 |16 |17 |18 |19 |20 |21 |22 |23 |24 |review |
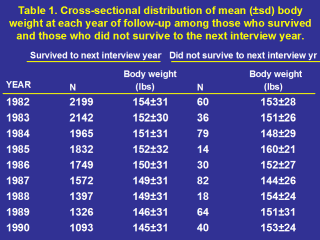 |
Table 1 shows the cross-sectional distribution of body weight at each year of follow-up according to subjects who did and did not survive to the next interview year. There was no observable pattern of lower or higher body weight between these two groups over the follow-up that might suggest weight loss was secondary to disease and death. |