| front |1 |2 |3 |4 |5 |6 |7 |8 |9 |10 |11 |12 |13 |14 |15 |16 |17 |18 |19 |20 |21 |22 |23 |24 |25 |26 |27 |28 |review |
 |
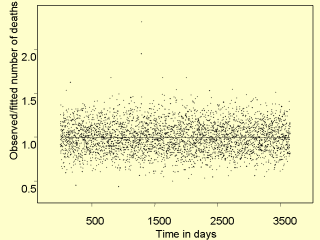
This graph shows that the cyclical variations in the original mortality time series have been removed. There are two days in which mortality was very high (~1500 days), although we did not determine the reasons for this. |