| front |1 |2 |3 |4 |5 |6 |7 |8 |9 |10 |11 |12 |13 |14 |15 |16 |17 |18 |19 |20 |21 |22 |23 |24 |25 |26 |27 |review |
 |
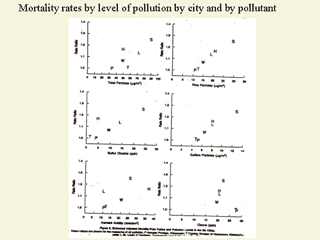
These are standardized mortality rates by city for each pollutant measured in the study. The y-axis represents the rate ratios for all-cause mortality, using Portage as the reference. Clockwise from the left, the graphs are for total suspended particles, fine particles, sulfur dioxide, sulfate particles, aerosol acidity, and ozone. No association was found for ozone. Source: Dockery et al, NEJM 1993;329:1753-9 |