| front |1 |2 |3 |4 |5 |6 |7 |8 |9 |10 |11 |12 |13 |14 |15 |16 |17 |review |
 |
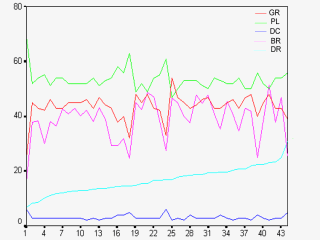
In this graphic GR stands for growth at 0-14 years, PL plateau at 15-64 years, DC decline after 65 years and over, BR birth rate and DR the sequenced death rates The low at 18 is South Africa, at 24 Gabon and at 39 Zimbabwe with BR at 25/1000. The highs of GR & BR at 25 belong to Uganda. |