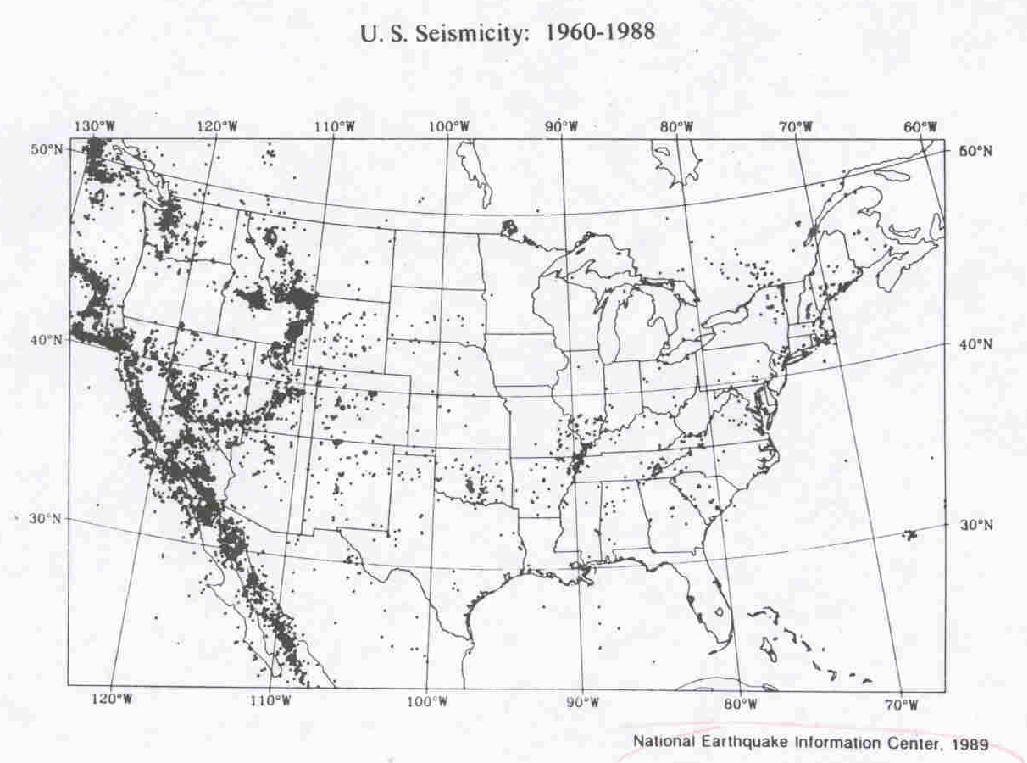
Figure 8--2:
United States seismic activity. This U.S. Geological Survey map depicts earthquake risk in the continental United States. The dots represent active seismic areas from 1960 to 1988. National Earthquake Information Center, 1989.