 Click for larger
picture |
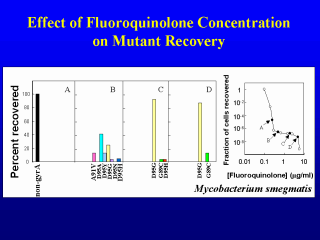
We next examined the effect of
fluoroquinolone concentration on the recovery of resistant mutants. A series of agar
plates were set up in which fluoroquinolone concentration was varied. Then a large number
of cells were applied, and mutants were recovered. An experiment with M. smegmatis
is shown in the right panel. The recovery of colonies drops sharply as the MIC is
approached. Then the recovered fraction exhibits a plateau, and finally it drops a second
time. We recovered mutants from the points indicated by the arrows and determined the
nucleotide sequences in the quinolone-resistance-determining regions (QRDRs) of the gyrase
genes. As shown in the panels on the left, the spectrum of mutants recovered varied with
the concentration of fluoroquinolone. At low concentrations there were so many
“non-gyrase” mutants that gyrase mutants were difficult to recover. As the selective
pressure increased, the non-gyrase mutants were eliminated and we recovered a variety of
gyrase mutants. At high drug concentrations only the least-susceptible gyrase mutant was
recovered (22). Data of this type led to the mutant selection window hypothesis (18). |
