| front |1 |2 |3 |4 |5 |6 |7 |8 |9 |10 |11 |12 |13 |14 |15 |16 |17 |18 |19 |20 |21 |22 |23 |24 |25 |26 |27 |28 |29 |30 |31 |32 |33 |34 |35 |review |
 |
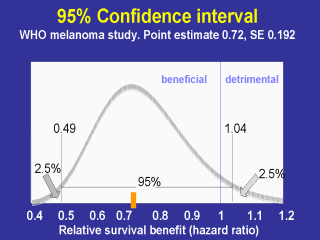
Letís look at the 95% CI again graphically. This shows the 95% confidence interval for the WHO study, with the hazard ratio of 0.72. We can say with 95% confidence that the true hazard ration lies between 0.49 and 1.04. You can see that it crosses 1, which is why it is not significant. The 95% CI does not tell us how likely it is that a survival benefit exists (Ie how likely it is that the hazard ratio is less than 1). |